![Wavey Dynamics Logo #2 [Dark, Transparent].png](https://static.wixstatic.com/media/67d9bf_65249c4015a14615b48d0aca40b0a4b0~mv2.png/v1/fill/w_269,h_67,al_c,q_85,usm_0.66_1.00_0.01,enc_avif,quality_auto/Wavey%20Dynamics%20Logo%20%232%20%5BDark%2C%20Transparent%5D.png)
Vehicle Dynamics: Lap Time Simulation.
- Jahee Campbell-Brennan

- Jun 15, 2020
- 9 min read
Updated: Sep 9, 2021
As technology has progressed over the decades and advancements in computer technology have been made, automotive engineering is a discipline that has reaped the benefits. The miniaturisation and digitisation of sensors has allowed a whole new world of data to be gathered and analysed around vehicle behaviour.
Powertrain control sensors lead the way in the digitisation of control systems. Chassis sensors soon followed with measurement of damper displacements, translational and rotational accelerations, temperatures, steering angles and a whole range of other parameters. This has allowed engineers to develop a complete picture of the cars character through real time observation, importantly giving insight into it’s response in dynamic and transient situations.
The Digital Age
With the advent of computer simulations such as FEA, CFD etc, the opportunity to use mathematical models to predict natural phenomena produced great advancements in their respective fields. Vehicle dynamics theory has long since derived the calculus required to describe vehicle behaviour, so the next logical step for automotive engineering was to build representative digital models of whole vehicles to aid the design process.
Over the years, the accuracy of these models has improved greatly through developments within multi-body dynamics software, allowing every link, joint, structural member, spring and damper in the real system to be simulated with their own relative movements, compliances and frequency responses.
At this stage, even highly non-linear components and their influence on vehicle behaviour, such as tyre models are developed enough to use for analytical purposes, and work is progressing rapidly.
So here we are today, where vehicle dynamics simulation is one of the most important elements of vehicle development for both the road and the race track. Starting at the design concept stages and running through right until the end of the last race of a season.
General dynamic simulations can be used during automotive development to assess a concept’s basic character and reaction to things like constant radius corners (chassis balance), step steer events (stability & balance) and even abuse cases such as curb strikes and potholes.
The Rise of Simulation
What i’d like to focus on here though is the rise of lap time simulations in a motorsport application as a means to really hone in on the optimum setup of a vehicle platform analytically, generating virtual data on it’s response to input which can be measured and manipulated in the same manner as physical chassis sensors.
Maximising Gains.
There are really two main ways in which these simulations are used to prepare a car for a race or test.
Scenario #1: Software can be tasked with the objective of understanding lap time sensitivity to certain elements of the car performance. Something which may be useful in deciding which elements of the car to focus development efforts on e.g. the aero package, suspension, or powertrain configurations.
This can also be super useful when in the concept development phase of a design, when you’re making choices on the basic architecture of the car. It will at some point be logical to investigate the question “At this track, is the fastest lap time more dependent on downforce, drag, tyres, suspension setup, engine power or weight?”
Scenario #2: Once a complete model of the vehicle has been built and correlated from real data gathered on a previous run at that particular track, simulations can be used to fine tune setup.
This kind of study would start with a question like “What combination of adjustments to my setup will give me the fastest lap or provide the driver with the most confidence?”
You may have 1. damper settings, 2. ride springs, 3. front and 4. rear wing adjustments and 5. ride heights available to play with to dial in a race trim over a weekend. With simulation software, you can evaluate all the possible combinations of those variables analytically to understand the combination that provides the best result for a specific KPI (Key Performance Indicator).
KPIs can be things like lap time, lateral acceleration, tyre energy, chassis balance, sector speed or narrowing right down; small details such as corner exit acceleration etc.
Let’s say there were 5 settings for each of the 5 variables listed above, thats a total of 3125 (5^5) simulation runs that can be assessed by the software. It doesn’t take long to see the cost and time advantages of simulation vs manually completing laps in the car!
At this point, you’d struggle to find a high level race team who aren’t using simulations as part of their day-to-day, especially so during the season as part of preparation before practice, qualifying and race events.
The optimal setup for a particular circuit is a constantly moving goal post. Changing weather and other ambient conditions can call for a very different approach throughout the race weekend, so it’s vital that we as race engineers are precise with our approach - where the benefits of an analytical, qualitative approach are essential.
So let’s get into the practical side of vehicle dynamics simulations and demonstrate with some lap time sims of the above two scenarios. I’ll take you through the process.
The Good Stuff
Dynamics simulations have seen mainstream use since the early 2000s through various software packages. I’m using VI-grade, which is used widely throughout automotive and motorsport disciplines.
So, the first thing to be aware of, as ever with simulation is the concept of good data in = good data out. A representative car model is essential.
Suspension hard points, CoM locations, kinematics and compliance, aeromaps, torque maps are all fairly straightforward to implement mathematically, but most importantly and with most difficulty - tyre models must be accurate in order to increase the correlation of simulated data with measured data.
Being a visco-elastic component with hysteresis, tyres are notoriously tricky to model as there are so many variables that dictate their frictional coefficient at any given moment. Vertical force, temperature, surface quality, moisture, wear levels, inflation pressure, are all some of the variables that create a very non-linear problem.
These have always been traditionally one of the big issues with correlation of simulation to reality, although improvements have been made in recent times, and will continue to be made as companies such as MegaRide make steps forward.
Either way, once you we have a vehicle model we’re ready to start simulating, so for starters let’s look at a simple lap-time sensitivity study.
Normally, the first task you’d perform is to correlate simulated data with real data, it’s unlikely that they would immediately mirror each other, so it can be a case of trial and error; going back to simulation setup to adjust correction factors and scales for parameters such as frictional coefficients and so on.
Once a level of correlation has been reached, we can be confident in the base model and begin with the main investigations.
With base chassis parameters chosen, i’m going to add 10% to each value and record the % change in lap time that follows.

For each of the parameters a simulation was run on an arbitrary circuit and compared to the base value.
The software used here, VI-grade, works with an iterative approach, so it will simulate a run of the track using performance limits established through an initial quasi-static simulation, if it reaches an an unfeasible state in a particular corner (defined by either excessive deviation from a pre-defined driver path, or excessive wheel slip), the relevant tractive, braking or cornering factors are scaled back until feasibility is met.
Once this process is repeated over an entire lap, the simulation is complete!
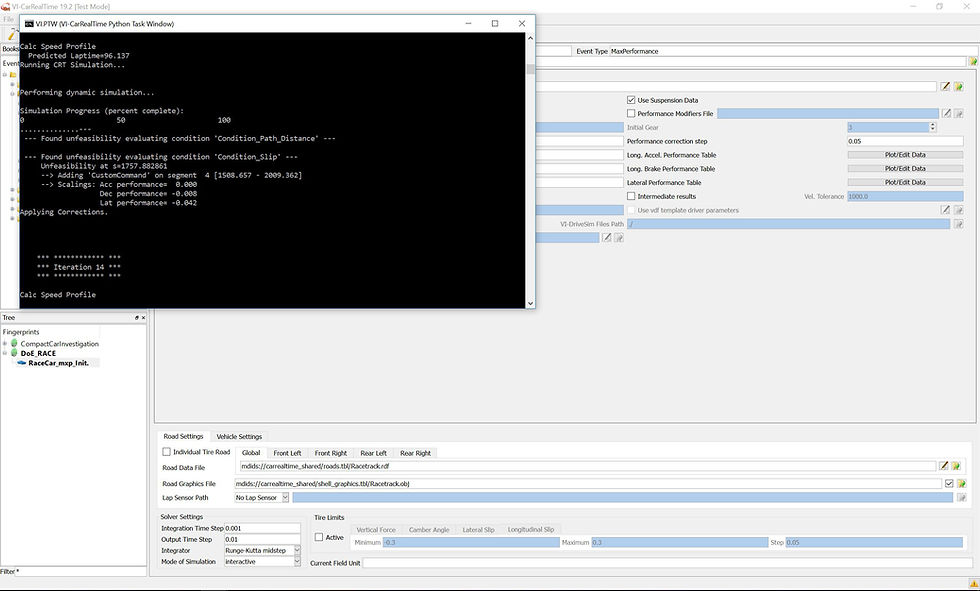
Here’s an example of the solved base configuration:

With the simulation complete, the data is ready to analyse.
In the same way as real sensor data taken is used after a run, the software allows post-processing of the results. Data can be displayed in user configured plots; histograms and maths channels can be configured to show any relationships you’d like, importantly, data can be overlaid so you can compare datasets from different runs/simulations.
Ultimately, the data shows you everything, but another useful feature is the capability to visualise the lap using 3D graphics. Visualising car behaviour is another tool that can be used to understand what the data is telling you combined with physically seeing what the car is doing.
Below, we’re looking at a comparison between the base car and the car with the wider track width, it’s easy to see that the larger track width is producing a larger peak lateral acceleration through reduced total lateral weight transfer, the ghost car confirms that visually.

So, the final results?

This platform, on this track is clearly most sensitive to vehicle weight and CoM height. Minimum weight is usually set by regulations, and once the platform is designed and built, you’ll struggle to make big changes to CoM position, but it at least highlights the significance of getting it right. Around +150kg of weight added nearly 3s to the lap time!
The track surface here was perfectly smooth, so the spring and damper rates aren’t doing much to influence lap times, any change here would appear to be due to their influence on management of weight transfer during the lap.
Interestingly, the lap time wasn’t so sensitive to aero performance, perhaps indicating that the track heavily features low speed corners. On the high speed straights, the drag penalty outweighs the gains in terms of lateral acceleration. Regardless, on a car with not so much downforce to begin with, +10% isn’t actually a significant change to normal force on the tyres. All useful information gained.
Of course i’m just trying to demonstrate concepts so this isn’t such an in depth experiment. For example if you changed the longitudinal CoM position you’d likely also change spring, damper and ARB rates, as well as your tyre width to accommodate the change. For these purposes though it’s a nice demonstration tool.
On to scenario #2.
As discussed earlier, it’s more useful/practical for race engineers to optimise setup for an event via running numerous lap simulations with a large number of different setup combinations, investigating a number of factors (setup variables in our case) in a full-factorial design and outputting the data with reference to a chosen KPI.
More often than not, the KPI will be lap time, but maybe you’d want to choose a setup conducive to a strong corner exit acceleration to gain an advantage over your competition preceding a long straight, or perhaps you need to make some drivability changes to make your driver more comfortable. With this, you have the freedom.
These simulations unlock a wealth of strategy considerations that would be really quite tricky or even impossible to dial in without some form of analytical approach.
Let’s run through the process.
Firstly, it's interesting to highlight the reality of fairly complex full-factorial experiments in that to run a practical simulation with just 3 settings/configurations for 8 vehicle parameters would be 6561 separate simulations. My office computer is not quite equipped to run these in a decent time frame just now (FYI vehicle dynamics simulations do also have cloud based solutions with much greater computing power), but for this article i’ll run a simpler study of just 81 different runs.
VI-grade uses simple scaling factors to represent different configurations for this kind of analysis, so i’m going to scale each factor by -0.5 and +0.5 relative to base setup and run the study.

Visualised, this creates the following experimental design:

What the above plot allows you to do is visualise how the experiment will run. I’m a visual learner so i often find plots like this to be helpful. It’s also interactive, which allows you to examine a KPI i.e. lowest lap time and trace it back, even highlighting which variant it is.
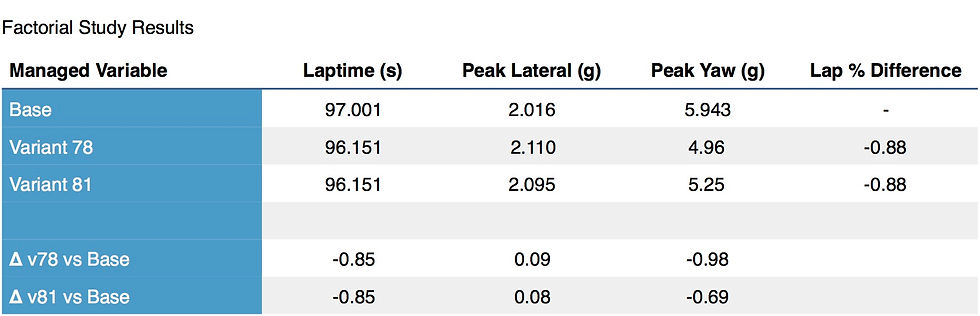
So, it was a draw between variant 78 and variant 81 in terms of laptime, but that doesn’t mean the handling characteristics are the same, so some further conditions must be taken into account, as a quick addition, i added peak lateral and yaw accelerations.
The simulation data can then be post-processed to reveal further relationships. Below, you can see the comparison between the two variants (#78 & #81).Same overall lap time, but clearly a different approach to the driving character and sector times!

There can be many inputs behind this behaviour; as a driver there are many reasons you may prefer one setup after another, but that’s not for today.
The simulation does not inherently understand the driver’s perception of ‘ good handling’ so this serves as a cautionary example that there are ‘caveats’ to be understood in order to apply the technology effectively. The results from lap time don’t immediately take into account things like driver preference or indeed drivability, which are important factors in the delivery of a fast lap.

Ultimately the subjective, human element is still valid input in any setup and simulation results can’t blindly be taken from the program and implemented. An experienced hand is still needed to interpret and implement the simulation data effectively.
Wrapping Up
With that i hope I’ve introduced those of you that were unaware, or wanted to learn a little more around lap simulations within modern motorsport.
Where is simulation going in the future? Effort is usefully focused on improving factors that are more complex to model. Things like exact driver lines, tyre models, brake performance modelling, damper hysteresis and other non-linear variables in performance are all things that if improved, will provide stronger correlation between measured and simulated data so we can expect progress to be made there.
There has also been a lot of focus recently on DiL simulation, which incorporates a real driver into the simulation as it is completed real-time. Compared to the script used in most programs, this provides a much more representative scenario, in which real driving styles and techniques can be used and valuable subjective feedback gained.
Expect the importance and reliance of vehicle dynamics and lap time simulation to only increase!
Thanks to VI-grade for their involvement in this article.
---
If you're requiring laptime simulation to support any of your projects don't hesitate to get in touch. We can help.


This was great! Im starting off learing more about laptime simulation and performance engineering, open for advice